Welcome To Street Investment


By Admin
Posted on June 11, 2025
Rejection in trading is something that everyone wants to learn — but why? Because if you can catch a rejection, it can give you the highest profit margin. Most professional traders mainly trade rejections, which is why learning this concept is extremely important.
This article covers everything you need to know about price rejection, rejection candles, rejection blocks, and how to interpret them to gain a trading edge.
Connect with pro Trader(100% free)
Rejection in trading refers to a situation where the price of an asset attempts to break a certain level (support or resistance) but fails and sharply reverses. This indicates that the market has rejected that price level, signaling a possible change in direction.
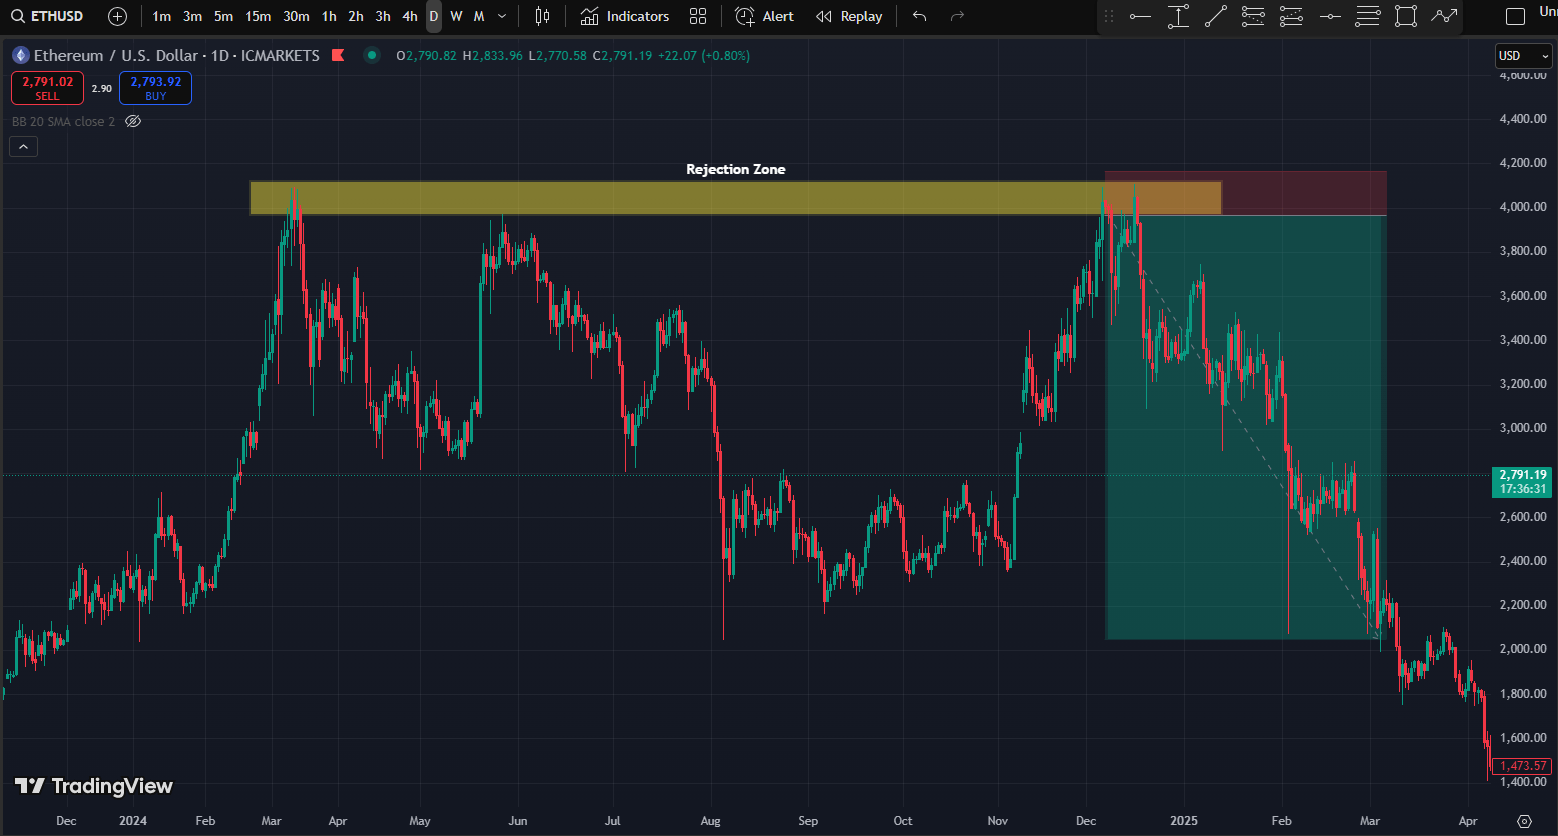
In rejection trading, price initially reverses from a supply or demand zone. But when the price returns to that same zone again, traders plan a rejection trade at that level and book profits with a high risk-to-reward ratio. I’ve clearly illustrated this concept in the image below.
Price rejection is observed when the market tests a level—like a resistance zone—but cannot close above it. The rejection suggests that traders are not willing to accept prices beyond a certain point.
If EUR/USD spikes to 1.1000 but closes below 1.0980 with a long upper wick, it’s a clear price rejection.
A rejection candle in trading is a candlestick with a long wick and small body, indicating strong reversal pressure. These are often used by price action traders to anticipate market turns.
Peak rejection occurs when the price reaches a high (or low) and is forcefully rejected, often forming a spike or wick. It usually happens at the end of a strong trend and can be a precursor to a reversal.
A rejection block in trading is a specific price area where multiple rejection candles form around the same level, creating a zone of heavy resistance or support.
In forex trading, rejection blocks are used in SMC (Smart Money Concepts) strategies to spot supply/demand zones.
The rejection value in trading refers to a price zone identified using tools like volume profile where the market rejects value areas (e.g., Value Area High or Low).
Forex markets behave differently due to high liquidity and the influence of global events. Rejection in forex trading is often sharper and more deceptive.
Understanding rejection in trading—whether it’s through candles, price zones, or volume—is essential for mastering technical analysis. It offers traders a window into market sentiment and hidden institutional activity.
By identifying price rejections, peak rejections, rejection blocks, and using rejection candles, you can improve your timing, reduce false breakouts, and build more effective trading strategies.
Keep practicing on demo accounts, study your charts, and make rejection analysis a key part of your trading toolkit.
Q: What is a rejection in technical analysis?
A: It’s a signal that price failed to break a level and reversed, often indicating trend exhaustion.
Q: Can rejection blocks be used with indicators?
A: Yes, especially with RSI, MACD, and Volume Profile.
Q: Are rejection candles reliable?
A: They are reliable when confirmed with context like trend, volume, or key levels.
Q: Is rejection trading good for beginners?
A: Yes, it’s a simple and powerful concept that improves entry/exit precision.
Soheb is a content writer with 5+ years of experience and a trading educator for the past 2 years. He specializes in forex, crypto, share market investing, and swing trading. With a strong grasp on both writing and trading, he simplifies complex market concepts into practical insights for learners and investors alike.

VMS TMT Ltd Share Price Target 2025, 2026, 2027, 2028, 2029, 2030 | Future Forecast, Monthly Outlook

Adani Green Share Price Target 2025, 2026, 2027, 2028, 2029, 2030 | Future Forecast, Monthly Outlook


